
Every summer, thousands of homeowners find a crack in a foundation wall or water in a basement and do the same thing: they search. What they find depends on a layer of the trade almost nobody measures: the websites. So we measured it.
Over the summer we collected 6,935 foundation-repair, basement-waterproofing and crawl-space companies across 57 of the 64 US states and Canadian provinces, audited 3,539 of their websites, and checked every company for advertising on Google and Meta. The result is the first State of Foundation Repair Websites, a report we’ll publish every year.
Read the full report — free, every market scored →
The six findings, in one paragraph each
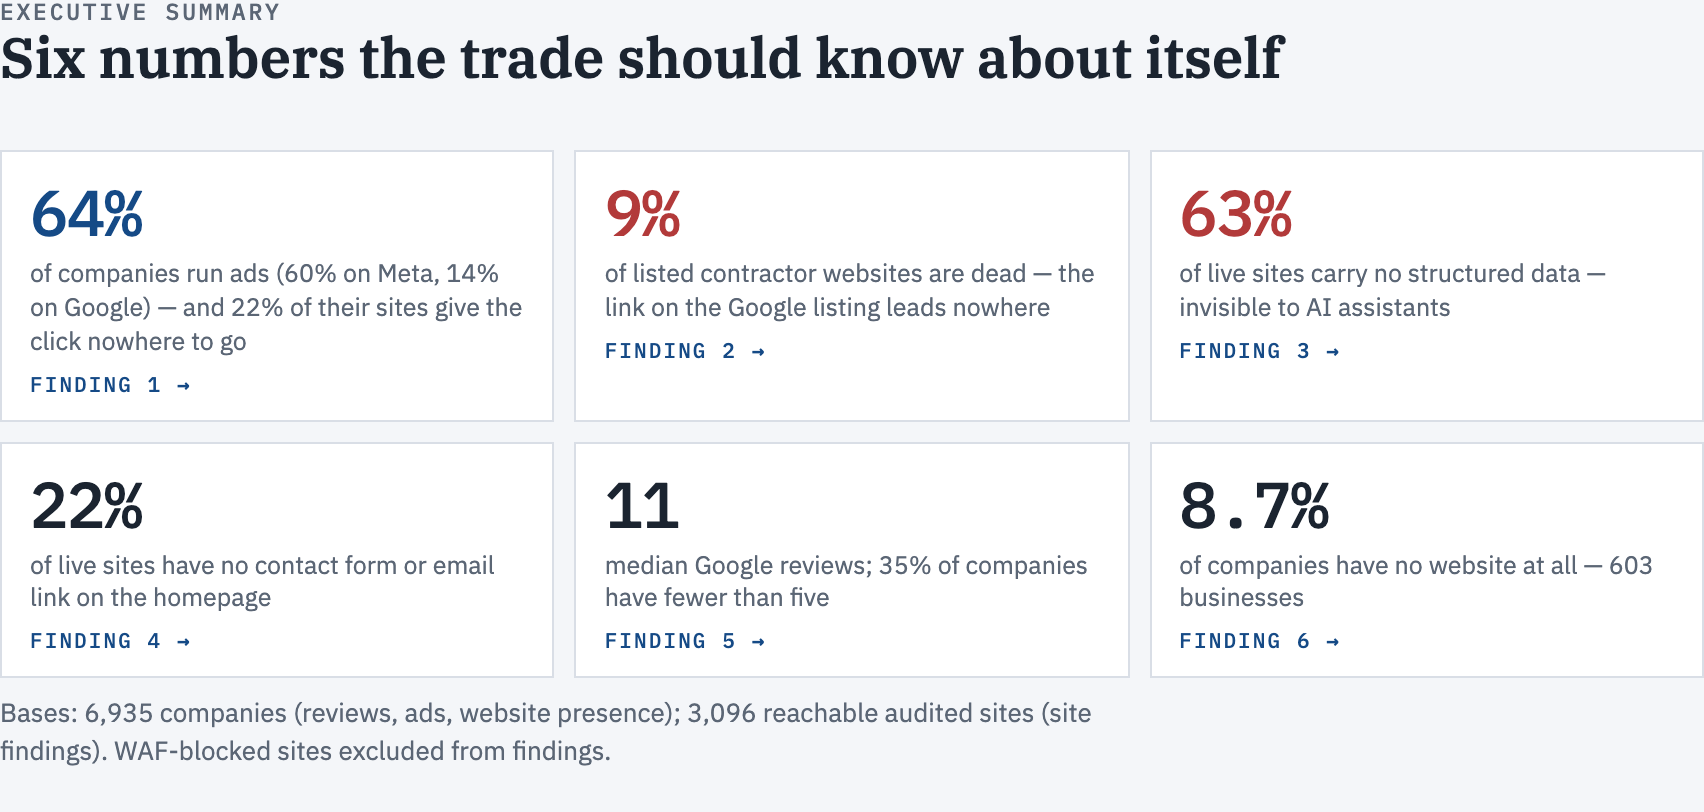
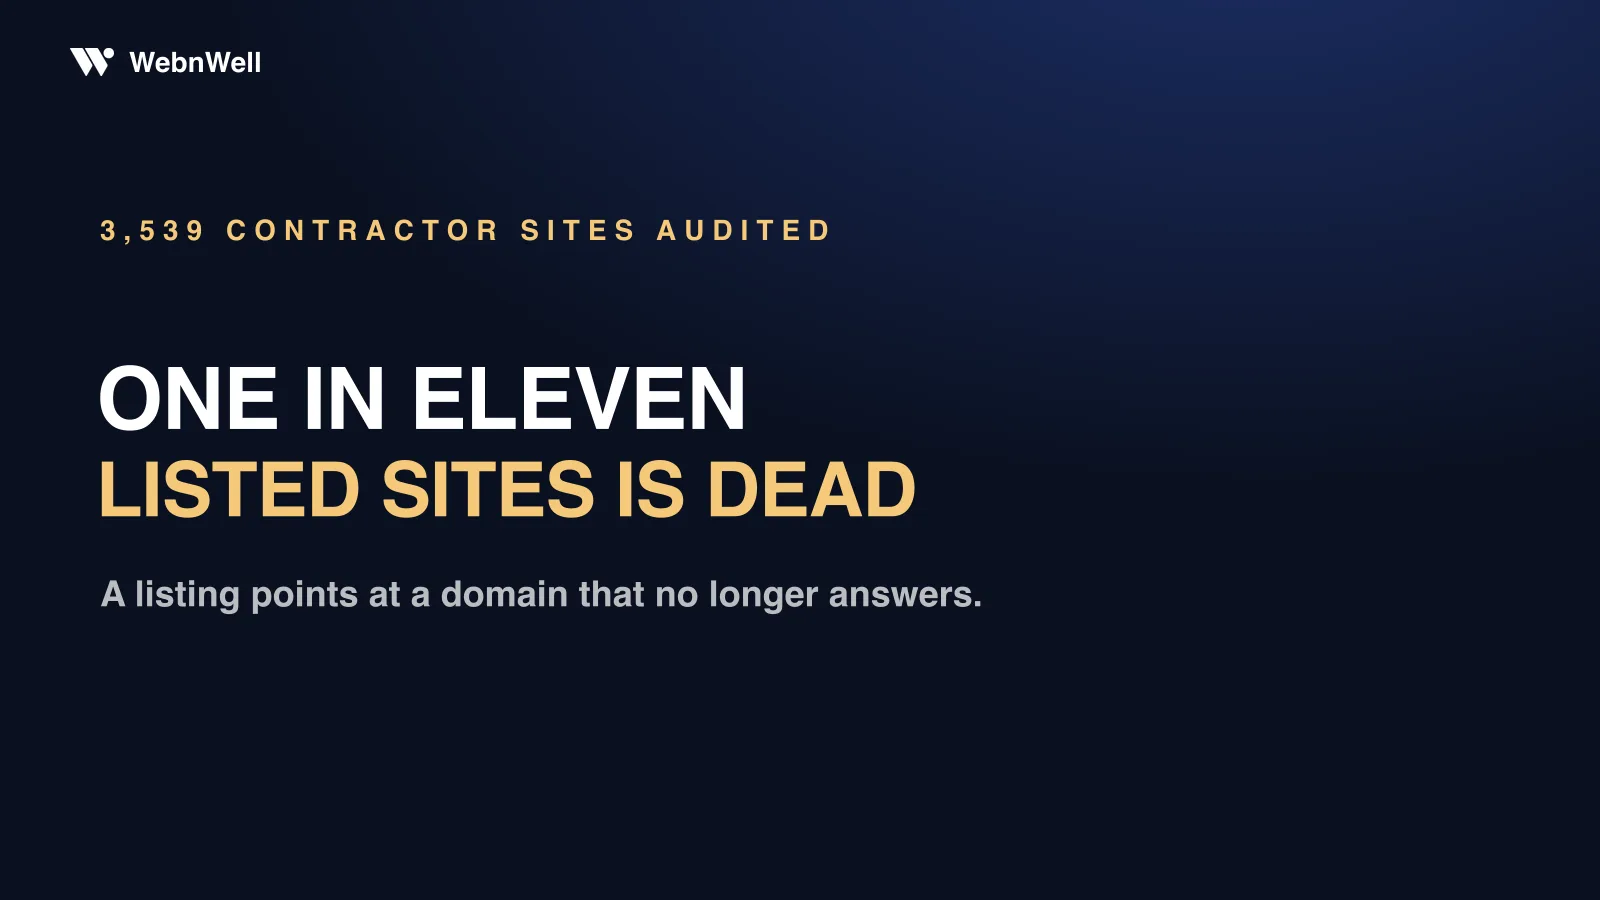
One in eleven links leads nowhere. 9% of the websites listed on contractors’ Google Business Profiles no longer load — expired domains, lapsed hosting, redirects into nothing. The owner rarely knows. Only the click-through disappears. Connecticut: 19%.
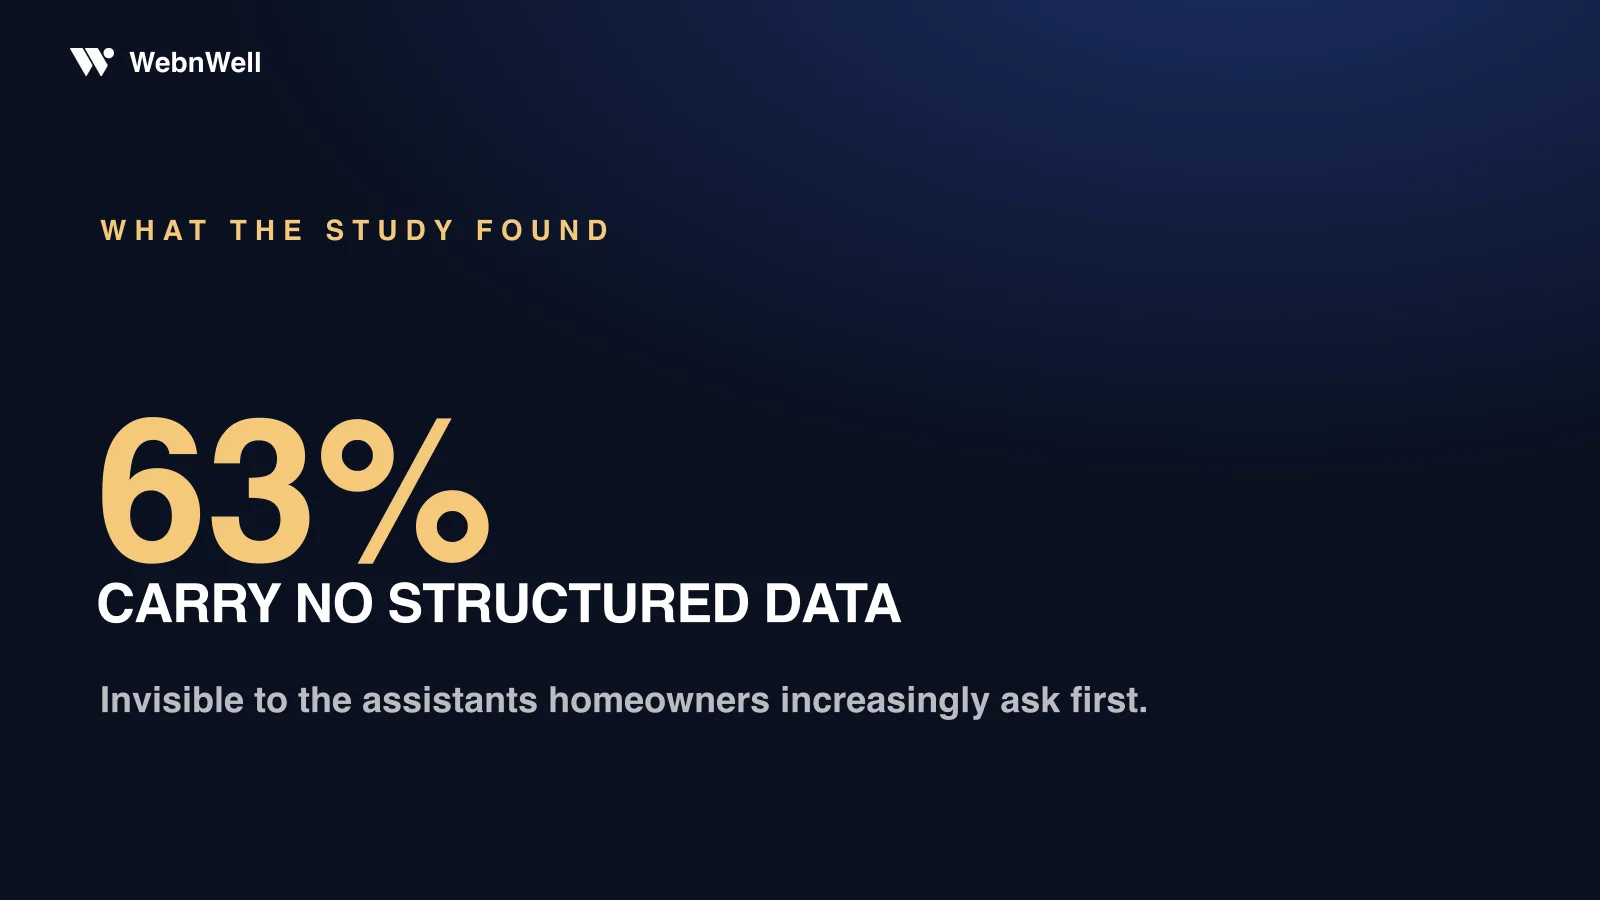
The trade is invisible to AI assistants. 63% of live sites carry no structured data, the layer that tells an assistant your name, phone, hours and service area with confidence. It is a block of markup rather than a rebuild, which makes it the cheapest thing on this list to fix.
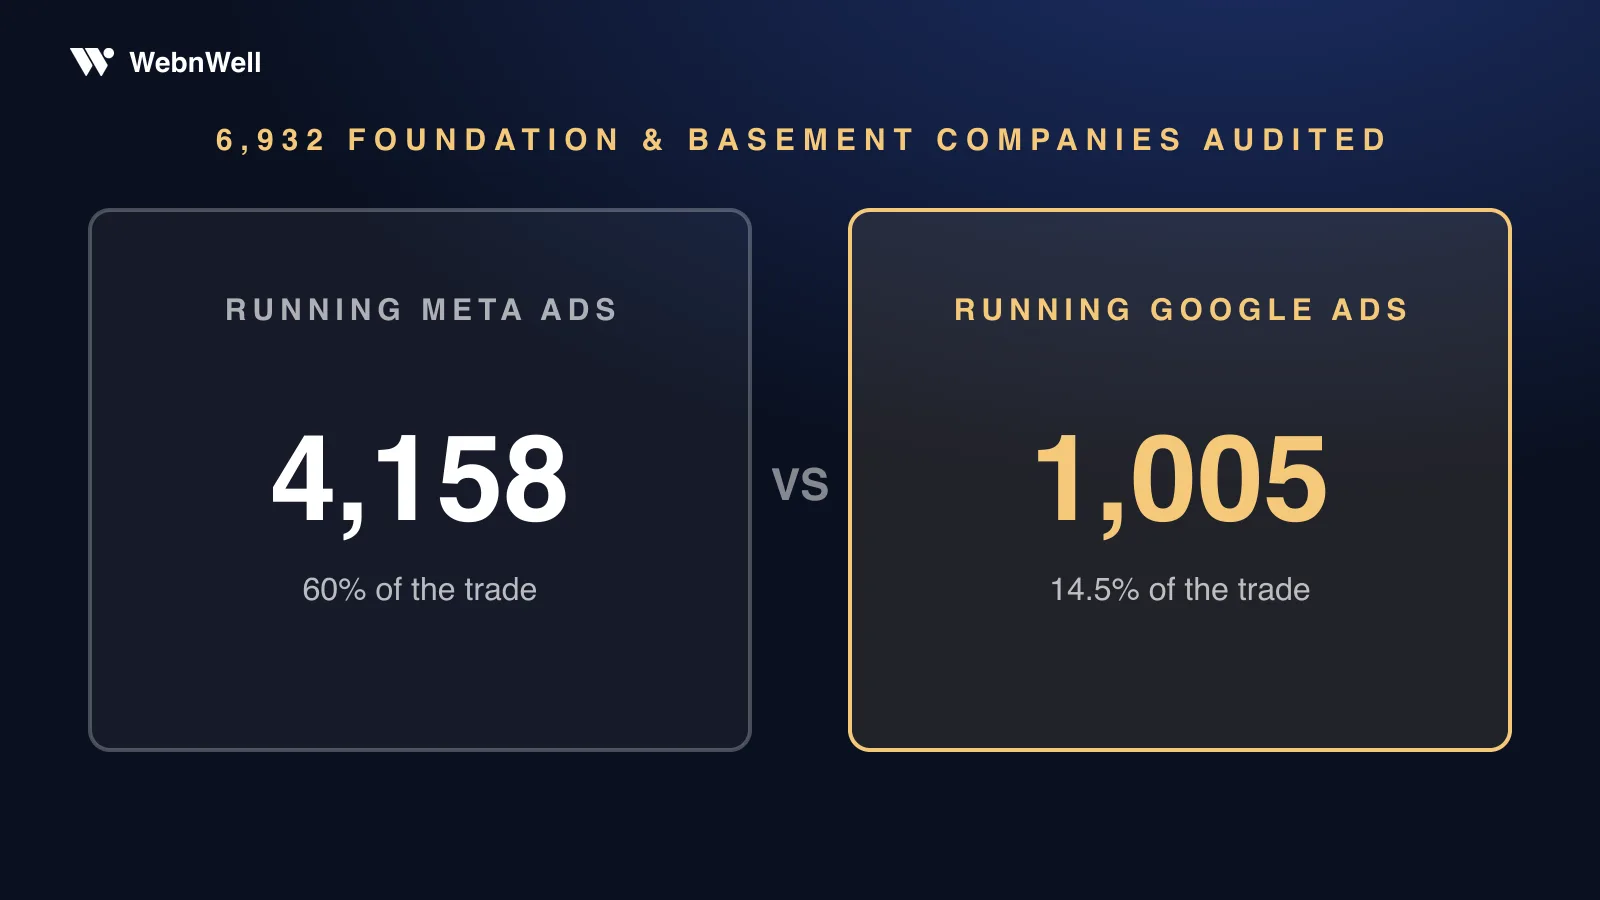
Paying for traffic, losing it at the door. 64% of companies run ads (60% on Meta, 14% on Google). Yet 22% of live sites offer no contact form or email link on the homepage, and 24% load slowly enough to lose visitors before the page appears.
The phone that can’t be tapped. On 18% of sites the number is plain text, so on a phone you cannot tap it. For an urgent trade, that is the highest-return five minutes in the report.
Reviews are a cliff, not a curve. The median company has 11 Google reviews; 35% have fewer than five; 8% have more than 150.
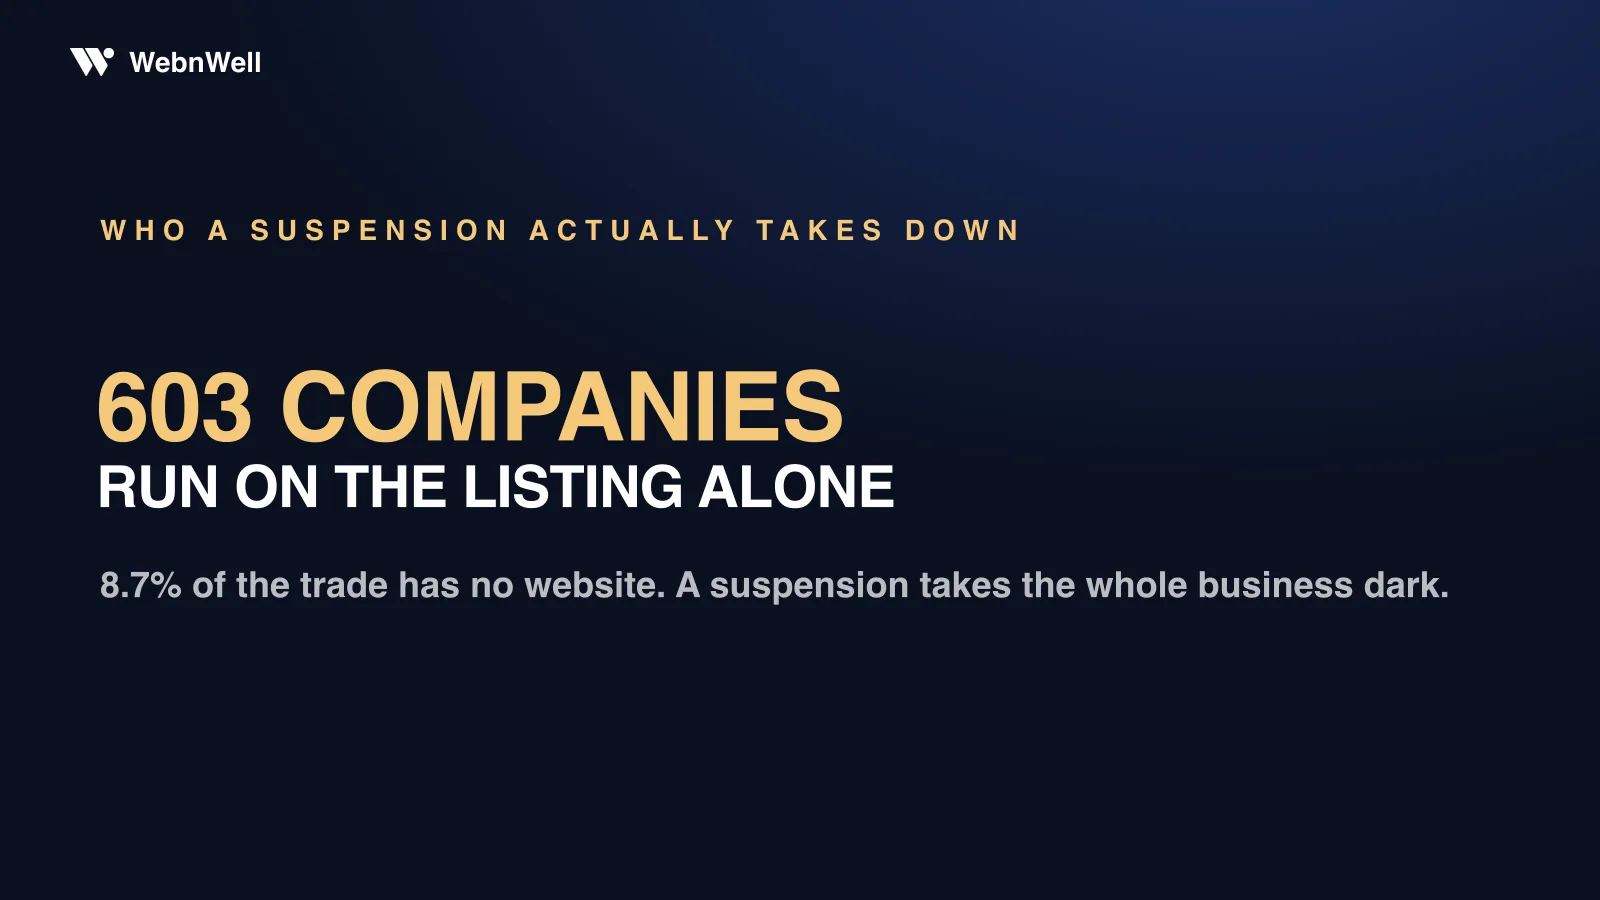
603 companies have no website at all. 8.7% of the trade runs on a Google listing alone, with no site behind it. That works better than it sounds for a company with a long review history and a strong map presence, because the listing carries the phone number and the photos. It stops working the moment a homeowner is comparing three quotes and wants to know who these people are, because two of the three have somewhere to send them and one has a blank. The listing gets you into the consideration set. It rarely wins the job on its own.
The finding that reorganised everything else
Split the audited sites into the strongest band (score 80+) and the weakest (under 60), then compare the companies behind them on two things the score does not measure: 91 average reviews against 18, and Google Ads at 21% against 3%.
We deliberately leave out the site features themselves. Structured data, a tappable phone and a contact form are inputs to the score that defines these two groups, so comparing the groups on them would restate our own scoring rule rather than find anything. Reviews and ad spend sit outside the score, which is what makes them worth reporting.
The data cannot prove cause. But the pattern is consistent: the companies that invest in the basics of their site are the same ones that ask for reviews and buy search traffic, and they are the ones homeowners find.
Your state, your site
The report scores all 57 markets where listings were found and names the best-built site in each, flagging the ones whose sample is too small to lean on. Every company in the study can also request its own scorecard, showing your findings, your local ranking and which competitors are advertising, free at webnwell.com/score.
The underlying data is published too, under CC BY 4.0: JSON and CSV, with the coverage and sample-size notes included so it can be checked rather than taken on trust.
We ran the study because the same handful of gaps turn up in nearly every market we open — they are the first things we fix in our foundation repair and waterproofing marketing work.